The page this skill built from examples/kestrel-series-b, working in your browser. Opens in a new tab. Also: Halvard board q3.
12 slides built by this skill from examples/kestrel-series-b and examples/halvard-board-q3
Example settingswhat each example above was built from
examples/kestrel-series-bdeck.json
- Brand
- Kestrel
- Headline
- Kestrel — Series B
- Slides
- 8 (title, statement, stats, line, bars, donut, funnel, closing)
examples/halvard-board-q3deck.json
- Brand
- Halvard Energy
- Headline
- Halvard Energy — Board update Q3
- Slides
- 7 (title, stats, line, donut, bars, statement, closing)
- Colors
- a1 #ffb547 · a2 #ff5d5d
What you get
- A dark browser deck where text rises in and every chart animates each time its slide opens
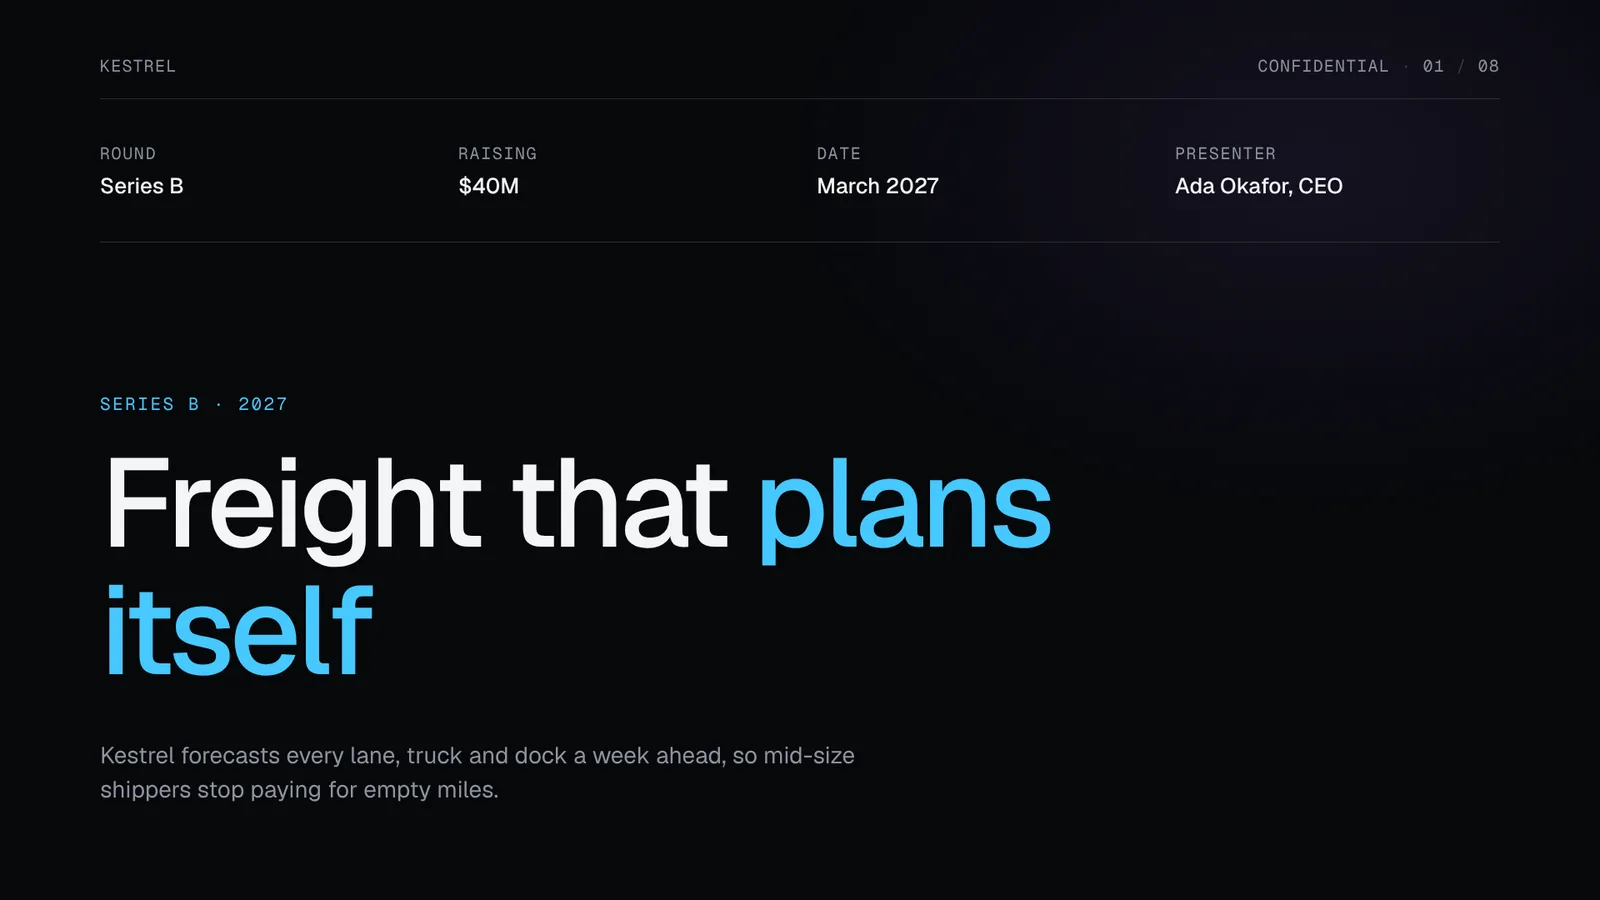
- Eight layouts: title with metadata, statement, stats with meters, line, bars, donut, funnel and closing
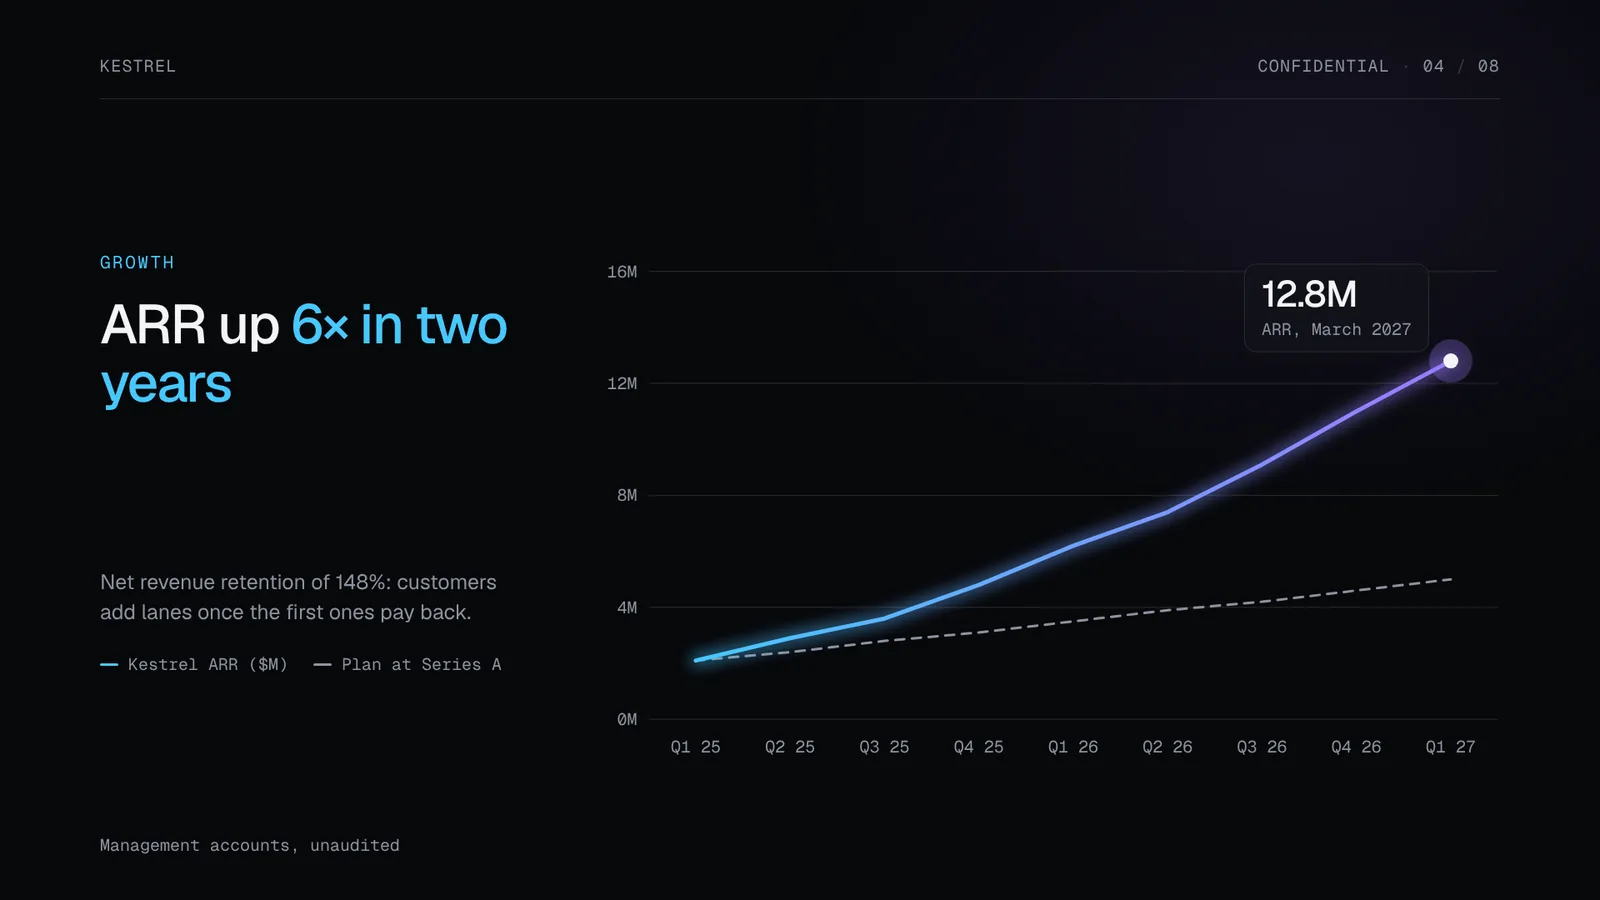
- Charts drawn from your numbers: a round axis, a dashed plan line, a called-out point, a highlighted bar and worked-out funnel conversions
- A PowerPoint file with real PowerPoint charts (Edit Data works), text boxes in the same places and your speaker notes
- A fit and contrast check on every slide, and a PDF of the finished slides
- Two example decks: a Series B pitch and a quarterly board update
- Open-source licenses for every part it builds on
Good fit
- Founders raising a Series A or B can show growth against plan, margins, revenue mix and the funnel, every chart drawn from their own figures.
- Finance leads preparing a quarterly board update get the numbers, the sources and an editable PowerPoint file in one pass.
- Teams presenting metrics on a big screen get a dark deck where each chart animates as its slide opens, with no design work.
Not for
- Decks built around a product photo or footage (see Morph Deck or Cinema Deck)
- Long written board memos with tables (see Investor Memo Deck)
- Light, printed-paper looks: the ground stays near-black
About this skill
A dark, data-first deck for investors and boards: hairline rules, mono labels, big numbers with meters, and charts drawn from your own figures. A line chart with your plan dashed underneath and the latest point called out, bars with one highlighted, a donut and a funnel that works out every conversion. In the browser the line draws itself, bars grow and the donut sweeps round each time a slide opens. Your agent builds it from your notes and numbers, checks every slide for fit and contrast, and exports a PDF and a PowerPoint file whose charts are real PowerPoint charts you can edit.
Example request
Make a Signal Deck for our Series B from pitch.md and metrics.csv: ARR by quarter against plan, gross margin by year, revenue mix and the sales funnel, with sources and speaker notes, then export the PDF and a PPTX.
How it works
Your agent
- 1
Plan the slides
Turn the material into 6 to 12 slides, one claim per slide, each with the figure that proves it.
- 2
Write
deck.jsonTop level:
titleandorgare required;tagsits in the top bar on every slide (like "Confidential" or "Board · Q3 2027");langdefaults toen. - 3
Build
It checks every slide, every chart's numbers (one label per value, the mark and highlight in range, no negative values) and the theme's contrast, lists every problem at once, then writes
out/index.html. - 4
Check it and look at every slide
Errors (exit code 1): text that doesn't fit its box even at the smallest size, text running off the slide, overlapping text, and text below contrast (4.5:1, or 3:1 for large text) on what really lies behind it.
- 5
Export the PDF
It writes
out/index.pdf, one 1920×1080 page per slide, and checks the page count. - 6
Export the PowerPoint file (optional)
It writes
out/index.pptxon PowerPoint's widescreen page. - 7
Hand it off
Give the person
out/index.htmlto present in the browser,index.pdfto send to investors or the board, andindex.pptxto edit in PowerPoint or Keynote.
- 1
You get
- out/index.html
- out/shots/slide-01.png
- out/index.pdf
- out/index.pptx
What you need
- Node.js 18 or newer.
- Chrome, Chromium or Edge installed, for the checks, the PDF and the PPTX. Set
CHROME_PATHif the scripts don't find it. - For the PPTX only:
npm i pptxgenjs@4.0.1in the folder you run the export from. - Internet access when the deck is opened, checked or exported, for the Google Fonts stylesheet.
- The person's real figures. The deck draws exactly what it is given; it never invents a number.
Last checked Nov 2, 2026: the package’s own build and render commands ran and passed.
If something goes wrong
build: fix deck.json firstEach line names the slide, the field and the limit. Shorten rather than work around limits.
9 labels for 8 valuesEvery chart needs exactly one label per value, and
compareneeds as many values asvalues.theme.a1 … reaches 3.1:1 on the groundThe accent is too dark for a near-black ground. Pick a lighter tint of the same hue.
What’s in the download
- SKILL.md11.7 KB
- assets/
- assets/base.css3.00 KBstage, overview, print
- assets/deck.css10.5 KBthe look and the motion of every layout
- assets/player.js17.7 KBthe browser player and the modes the scripts use
- examples/
- examples/halvard-board-q3/2.72 KBa quarterly board update, 7 slides, amber and red, Inter Tight · 1 file
- examples/kestrel-series-b/3.81 KBa Series B pitch, 8 slides, cyan and violet · 1 file
- scripts/
- scripts/build.mjs17.1 KBthe layouts, the chart drawing (axis, line, bars, donut, funnel) and the theme rules; checks
deck.jsonand buildsout/index.html. - scripts/check-deck.mjs5.19 KBfit, overlap and contrast checks, and the slide pictures.
- scripts/chrome.mjs3.63 KBheadless Chrome
- scripts/color.mjs1.40 KBcolour and contrast
- scripts/deck-core.mjs7.84 KBfield rules and validator
- scripts/export-pdf.mjs1.90 KBthe exports; the PPTX one rebuilds every chart as a native PowerPoint chart with its data.
- scripts/export-pptx.mjs9.13 KB
- scripts/headless.mjs1015 B
- scripts/png.mjs2.26 KBreads the check's screenshots
- NOTICE.md1.33 KBthird-party software and fonts.
- TESTED.json639 B
17 files · 101 KB · installs to ~/.claude/skills/signal-deck for Claude Code and ~/.agents/skills/signal-deck for other agents
Credits and licenses: NOTICE.md plus any LICENSE files inside the ZIP.
Similar Skills
View allDetails
- Output
- Dark HTML deck with charts that draw + PDF + PPTX with editable charts · 6–12 slides
- Needs
- Node.js 18+ and Chrome for the checks and exports; pptxgenjs only for the PowerPoint file
- Series
- Decks · 6 skills
- Updated
- Nov 2, 2026
- Checked
- Nov 2, 2026: its own commands ran and passed. That is a working check, not a security audit.
Written for
See all 31 agents that read skill folders.
Install guides
For your agent
Generates with
Installed it? Tell others how it went. Reviews come from people who installed this skill.
Write a reviewFAQ
Are the charts in the PowerPoint file editable?
Yes. Every line, bar and donut chart is a real PowerPoint chart with its data inside, so right-click and Edit Data works. It sits on the same plot area with the same axis and colours as the browser deck, and the highlighted bar stays highlighted.
Can it invent numbers for me?
No. Charts are drawn only from the figures in deck.json, and the build refuses a chart whose labels and values do not match. Each chart slide has a source line, so readers see where every number comes from.
Can I use my own colours and fonts?
Yes. Set two accent colours and any Google Fonts pair in the theme. The build checks the accent reaches 4.5:1 on the near-black ground, and the second accent reaches 3:1, before anything is written.
Which agents is Signal Deck written for?
Any agent that reads SKILL.md folders, including Claude Code, Codex, Cursor, GitHub Copilot, Gemini CLI and OpenCode.
Do I own what I make with it?
Yes. Everything your agent makes with this skill is yours, including for client and commercial work.
What if it doesn’t work for me?
Email support@lookbk.dev within 7 days of buying and we’ll fix it or refund you.
Credits and licensesBuilt on gitbrent/PptxGenJS
What Lookbk adds on top of gitbrent/PptxGenJS (MIT): the layouts, the chart drawing, the player, the checks and the exports, all written for Lookbk. PptxGenJS (MIT) writes the PowerPoint file and its charts.
Credits and licenses for the open-source software and fonts it uses are in NOTICE.md inside the download.