Data Stories: animated chart videos
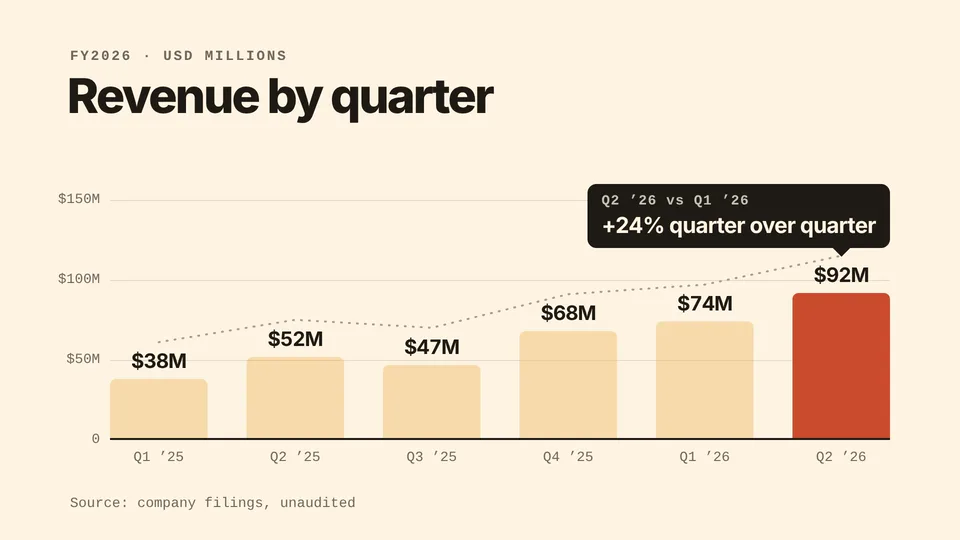
A 12-second video of one number worth sharing: bars grow with counting values, a trend line draws through them and the bar that matters gets a callout. Give your agent a CSV and a headline and it renders the MP4 on your machine. For marketers and analysts posting a result, from Claude Code, Codex, Cursor or another SKILL.md agent.
1 skill
Questions
Can I chart more than one series or more than 12 bars?
No. It shows one series as up to 12 bars with positive values, and one bar is highlighted. From a longer table, its CSV script keeps the last 12 rows.
Which agents can use the Data Stories skills?
Any agent that reads SKILL.md folders, including Claude Code, Codex, Cursor, GitHub Copilot, Gemini CLI and OpenCode. Paste the install prompt from a skill page into your agent, or run the one-line command in a terminal.
Are the Data Stories skills free?
Data Story: Bars is a Pro skill: buy it once for $6.90, or get Pro for $19 a month (10 Pro skills a month) or $99 a year.